Set Up Distributed Tracing
Learn how to connect events across applications/services.
Distributed tracing connects and records the path of requests as they travel through the different tiers of your application architecture. If your architecture consists of multiple services that live on different sub-domains (e.g. fe.example.com and api.example.com), distributed tracing will help you follow the path of events as they move from one service to another.
This end-to-end visibility allows developers to identify bottlenecks, pinpoint the root cause of errors, and understand component interactions—turning what would be a complex debugging nightmare into a manageable process that improves system reliability and performance.
Here's an example showing a distributed trace in Sentry:
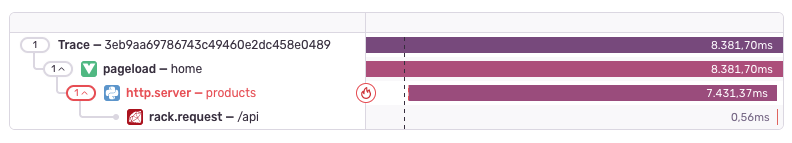
This distributed trace shows a Vue app's pageload making a request to a Python backend, which then calls the /api endpoint of a Ruby microservice.
What happens in the background is that Sentry uses reads and further propagates two HTTP headers between your applications:
sentry-tracebaggage
If you run any JavaScript applications in your distributed system, make sure that those two headers are added to your CORS allowlist and won't be blocked or stripped by your proxy servers, gateways, or firewalls.
In version 8.0.0 and above of the Sentry Node SDK, distributed tracing will work out of the box.
Sentry.init({
dsn: "https://examplePublicKey@o0.ingest.sentry.io/0example-org / example-project",
tracesSampleRate: 1,
});
If you don't want to use tracing, you can set up Custom Instrumentation for distributed tracing.
Sentry.init({
dsn: "https://examplePublicKey@o0.ingest.sentry.io/0example-org / example-project",
tracePropagationTargets: [
"https://api.myecommerce.com",
"https://auth.myecommerce.com",
/^\/internal-api\//,
],
});
This tells Sentry to track user journeys across three places:
- Your main API server (where product data comes from)
- Your authentication server (where logins happen)
- Any API calls that start with "/internal-api/" on your current domain
This way, if a customer experiences an error during checkout, you can see the complete path their request took across these different services.
Sentry.init({
dsn: "https://examplePublicKey@o0.ingest.sentry.io/0example-org / example-project",
// Capture 100% of spans. This is useful for development and debugging. Consider reducing in production or using traceSampler
tracesSampleRate: 1.0,
tracePropagationTargets: [
"https://api.myapp.com",
"https://media.myapp.com",
/^\/local-api\//,
],
});
This configuration lets your app track user actions across:
- Your main API server (handles most app functions)
- Your media server (handles images, videos, etc.)
- Any local API endpoints in your app
If your app crashes while a user is uploading a photo, you can trace exactly where the problem occurred - in the app itself, the main API, or the media service.
If you want to disable distributed tracing and ensure no Sentry trace headers are sent, you can configure your SDK like this:
Sentry.init({
dsn: "https://examplePublicKey@o0.ingest.sentry.io/0example-org / example-project",
// Overwrite the defaults to ensure no trace headers are sent
tracePropagationTargets: [],
});
Remember that in order to propagate trace information through your whole distributed system, you have to use Sentry in all of the involved services and applications. Take a look at the respective SDK documentation to learn how distributed tracing can be enabled for each platform.
Server-side SDKs handle traces automatically on a per-request basis. This means that SDKs will:
- Continue an existing trace if the incoming request contains a trace header.
- Start a new trace if the incoming request does not contain a trace header. This trace stays active until the response is sent.
If necessary, you can override the default trace duration by manually starting a new trace.
Our documentation is open source and available on GitHub. Your contributions are welcome, whether fixing a typo (drat!) or suggesting an update ("yeah, this would be better").